 With modern screening technology, it has become much easier to make large-scale measurements, but it hasn’t become much easier to convert these observations into hypotheses about what’s really going on in your test tubes — until now.
DMax Chemistry Assistant™ automatically finds, formulates and shows scientific hypotheses that best match your observations.
DMax Chemistry Assistant™ has the unique ability to start from individual functional groups and rings and construct hypotheses that combine these building blocks with relational expressions, such as “A is linked to B via a conjugated system“. Thus, a priori descriptors or fingerprints are not required. Still, your existing properties can be imported.
The hypotheses are automatically validated on a separate test set, and can be collectively applied to unseen compounds for virtual screening.
Whether you are into QSAR, high throughput screening, virtual screening, or lead optimization, DMax Chemistry Assistant™ is an invaluable tool for understanding your data.
Screenshots
The few screenshots below only illustrate a subset of the functionalities of DMax Chemistry Assistant™. Browse the tutorial for more. The illustrations are based on data taken from NCI human tumor growth cell line (COLO 205 Colon).
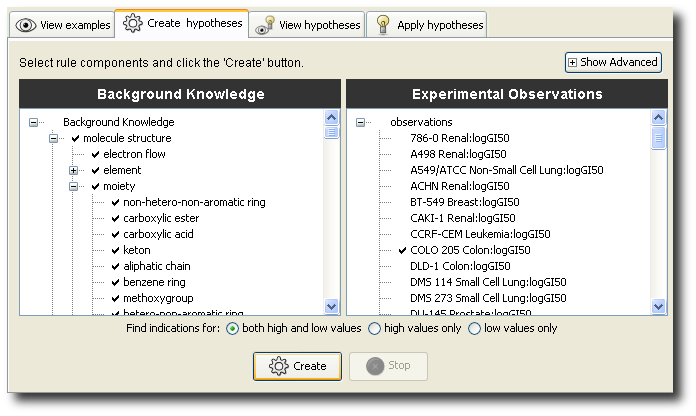
Above: you can decide on the eligibility for inclusion in the model of arbitrary types of 2D structural features, HTS observations, and other properties.
Below is an example of an automatically generated hypothesis that explains (with very high confidence) low values for “COLO 205 Colon: logGI50”.
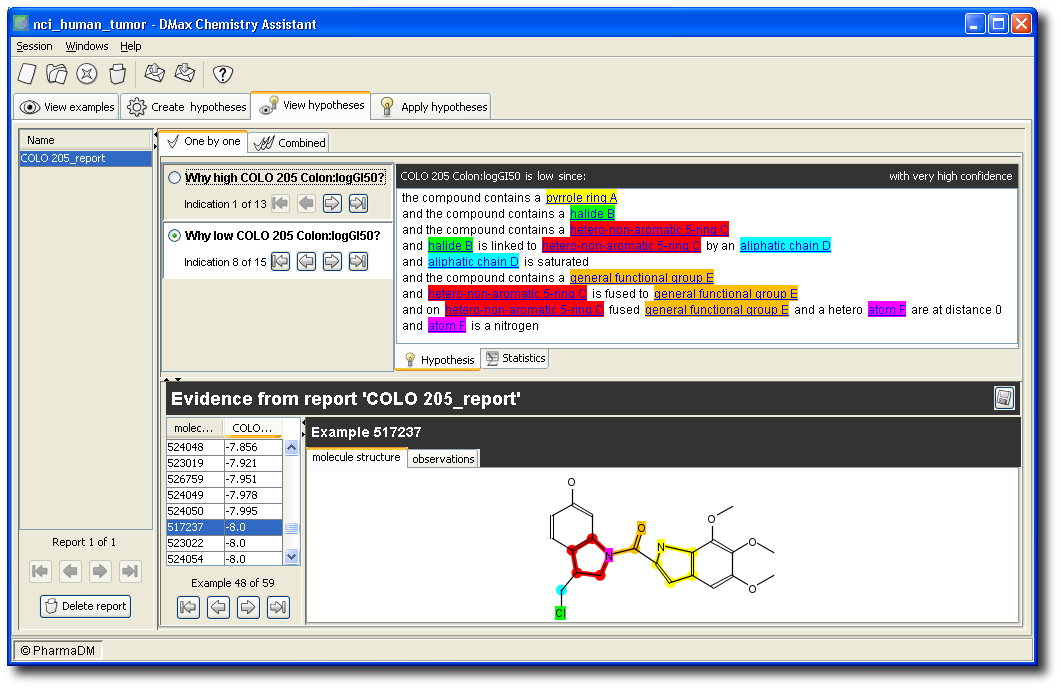
The color codes link the text to the molecule drawings.
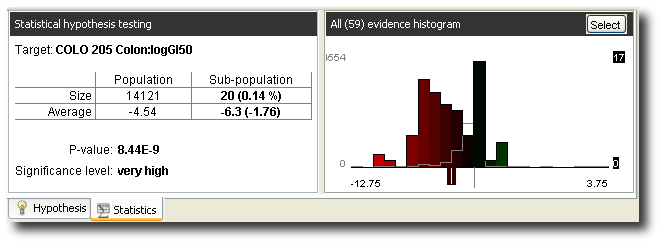
Below are the statistics (obtained on a separate test set) for the hypothesis in isolation.
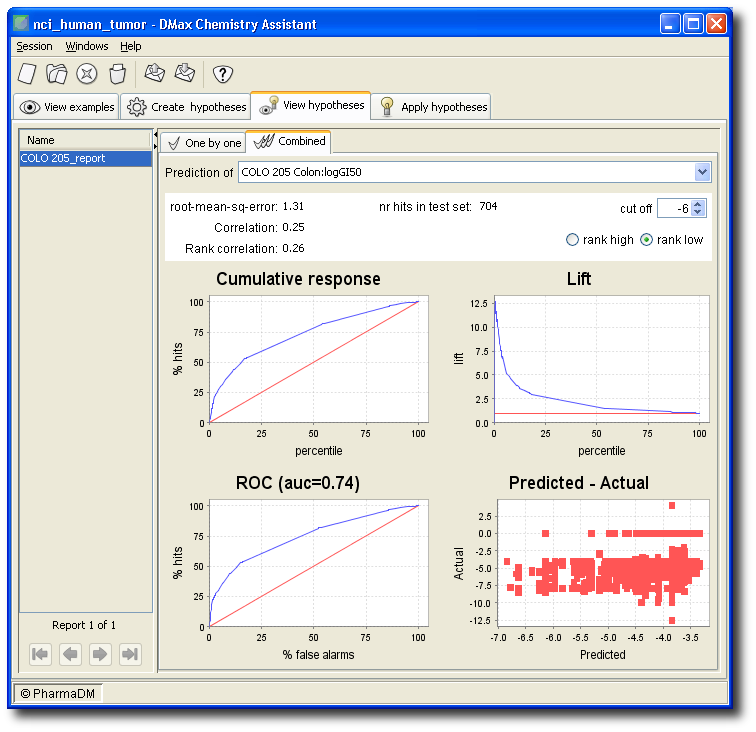
On the bases of all hypotheses, a model is constructed for the prediction of the property. The performance of that model (again, on a separate test set) is shown as below.
You can use the generated model for virtual screening (both ranking and prediction). In the example below, a trivial single-hypothesis model is applied to the new compound library “nci_sample”.
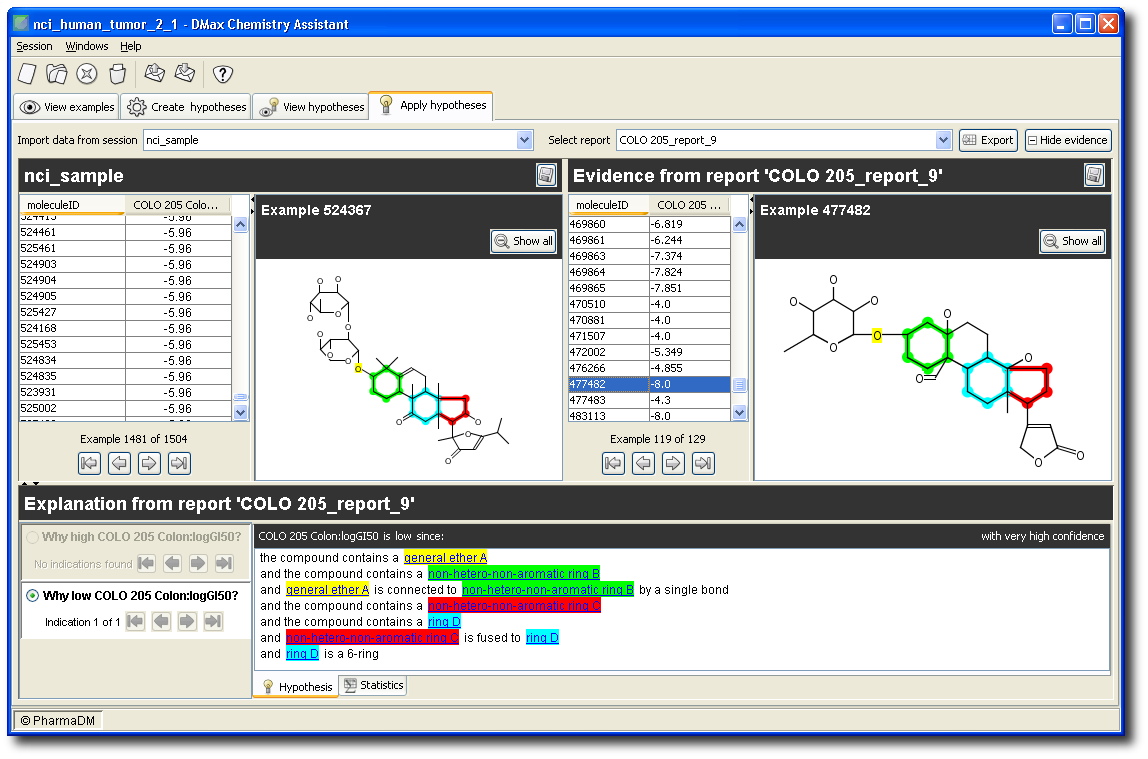
Notice in the left panel that new compound “524367” is predicted to have a value for “COLO 205 Colon: logGI50” of -5.96. You can find the hypotheses underlying that prediction in the bottom panel. In this case, there is just one hypothesis that applies.
The examples underlying this hypothesis are shown in the right panel. For instance, one of the examples from our NCI data set that support the hypothesis is “477482”.
Notice that color codes link the ranked molecules in the left panel, to the hypothesis text in the bottom panel, to the reference molecules in the right panel.
» Read the brochure (PDF),
» read the Frequently Asked Questions,
» browse the tutorial,
» request a trial